Hello folks🙌....
In this article, I delve into a significant financial challenge – a persistent issue in the world of finance where daily stock prices create subsequent problems. This financial hurdle has been approached through the lens of computer science, leading to innovative solutions.
Let me first elucidate the problem:
The stock range dilemma revolves around daily stock prices. It hinges on determining the number of consecutive days when a stock price remains equal to or below today's price. In essence, it involves counting backward from today (inclusive) based on specific rules governing stock price movements.
Let's consider the example price array: {5, 4, 3, 4, 5, 6, 3}. We will calculate the stock span for each day using this array.
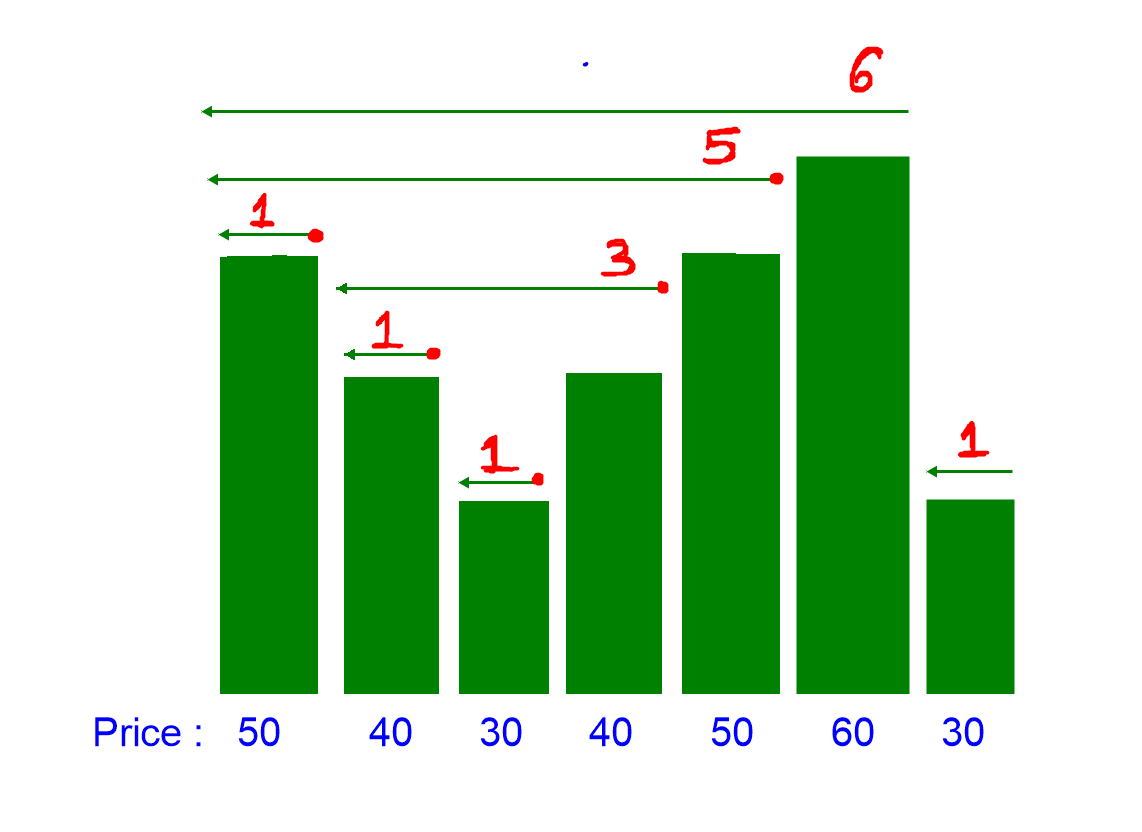
Certainly! Let's calculate the stock spans for the given price array: {50, 40, 30, 40, 50, 60, 30}
Day 0 (Price = 50):
- There is no previous day to compare, so the stock span for Day 0 is 1.
Day 1 (Price = 40):
- The previous day's price (Day 0) is 50, which is greater than 40. So, the stock span for Day 1 is 1.
Day 2 (Price = 30):
- The previous day's price (Day 1) is 40, which is greater than 30. So, the stock span for Day 2 is 1.
Day 3 (Price = 40):
- The previous day's price (Day 2) is 30, which is less than 40. Also, the stock span for Day 2 was 1. So, the stock span for Day 3 is 1 + 1 = 2.
Day 4 (Price = 50):
- The previous day's prices (Day 3, 2, 1, 0) are all less than 50. Also, the stock spans for these days were 2, 1, 1, and 1 respectively. So, the stock span for Day 4 is 1 + 1 + 1 + 1 = 4.
Day 5 (Price = 60):
- The previous day's prices (Day 4, 3, 2, 1, 0) are all less than 60. Also, the stock spans for these days were 4, 2, 1, 1, and 1 respectively. So, the stock span for Day 5 is 1 + 1 + 1 + 1 + 1 = 5.
Day 6 (Price = 30):
- The previous day's price (Day 5) is 60, which is greater than 30. So, the stock span for Day 6 is 1.
In summary, the calculated stock spans for the given price array are: {1, 1, 1, 2, 4, 5, 1} respectively for days 0 to 6.
Now let's discuss the solution approaches to the problem...
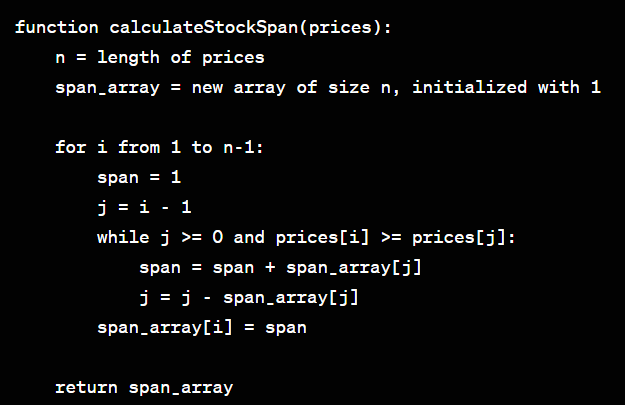
Naive Approach / Algorithm
- Start from the first day and iterate through the price array.
- For each day, initialize the stock span to 1, as there is at least one day in the span (the current day itself).
- For the current day, traverse backward to the previous days.
- For each previous day, compare its price with the current day's price. : If the previous day's price is less than or equal to the current day's price, increment the stock span and move to the next previous day. If the price is greater, stop the traversal.
- Store the calculated stock span for the current day.
- Repeat steps 3-6 for all days in the price array.
Time Complexity Analysis:
The naive approach checks all previous days for each day, making it quadratic in time complexity, O(n^2), where n is the number of days in the price array.
It is not the most efficient solution for large datasets, but it provides a straightforward understanding of the problem.
What can be the better solution?
The stack-based approach provides an efficient solution to the stock span problem. It utilizes a stack to keep track of the indices of the previous days' prices in the price array.
Let's discuss the
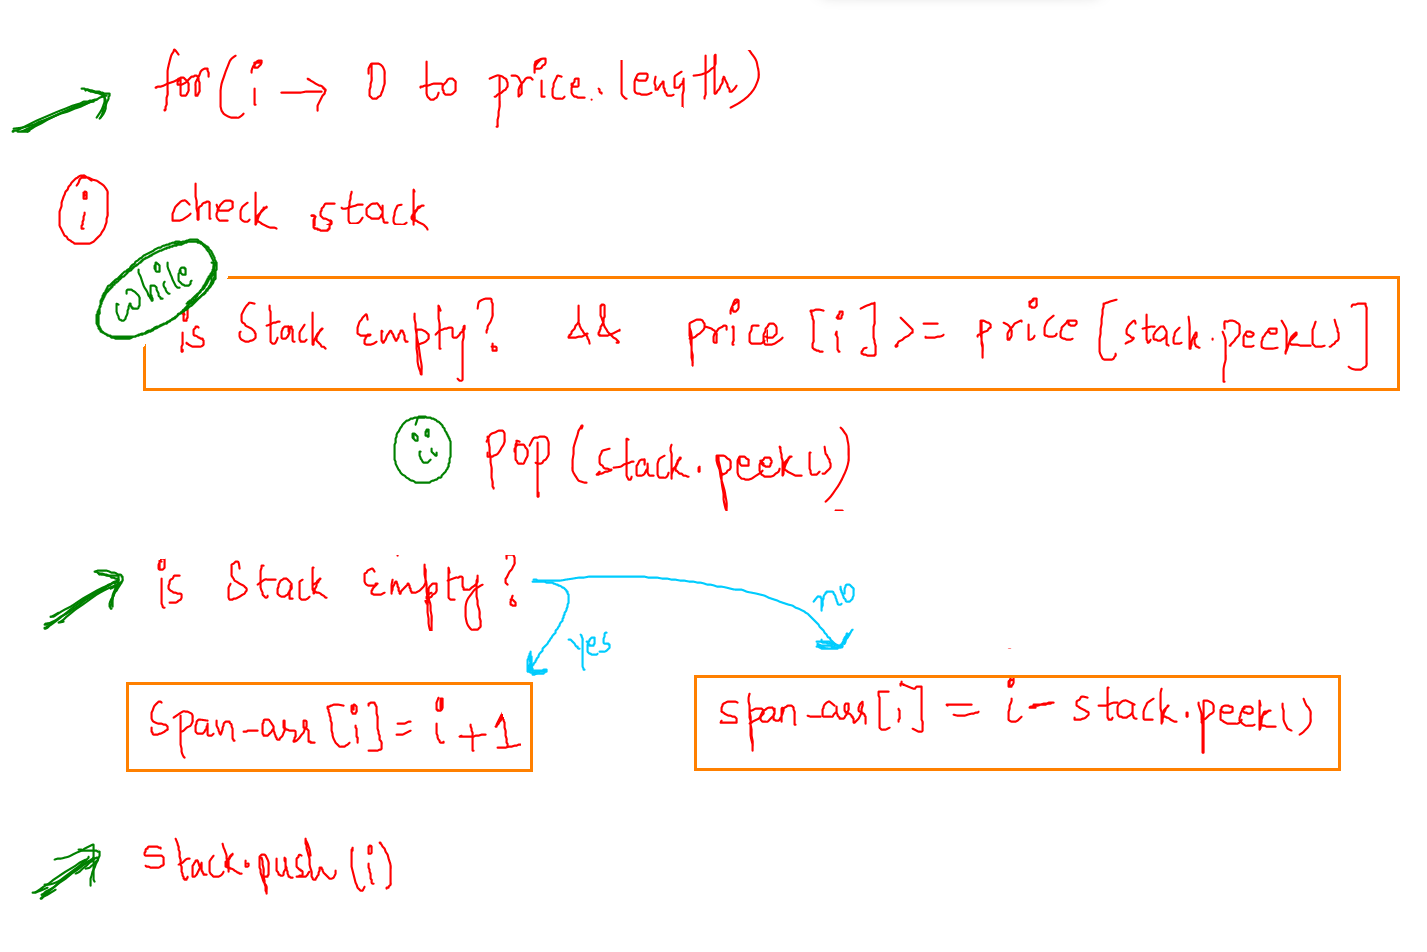
Stock Span Algorithm using Stack
- Create an empty stack and an array to store the stock spans.
- Iterate through the price array.
- For each day's price, pop elements from the stack while the stack is not empty and the current price is greater than the price at the index stored in the stack top. For each popped element, add its span to the current day's span.
- Push the current day's index onto the stack.
- Repeat steps 3-4 for all days in the price array.
Understanding Example With Diagram
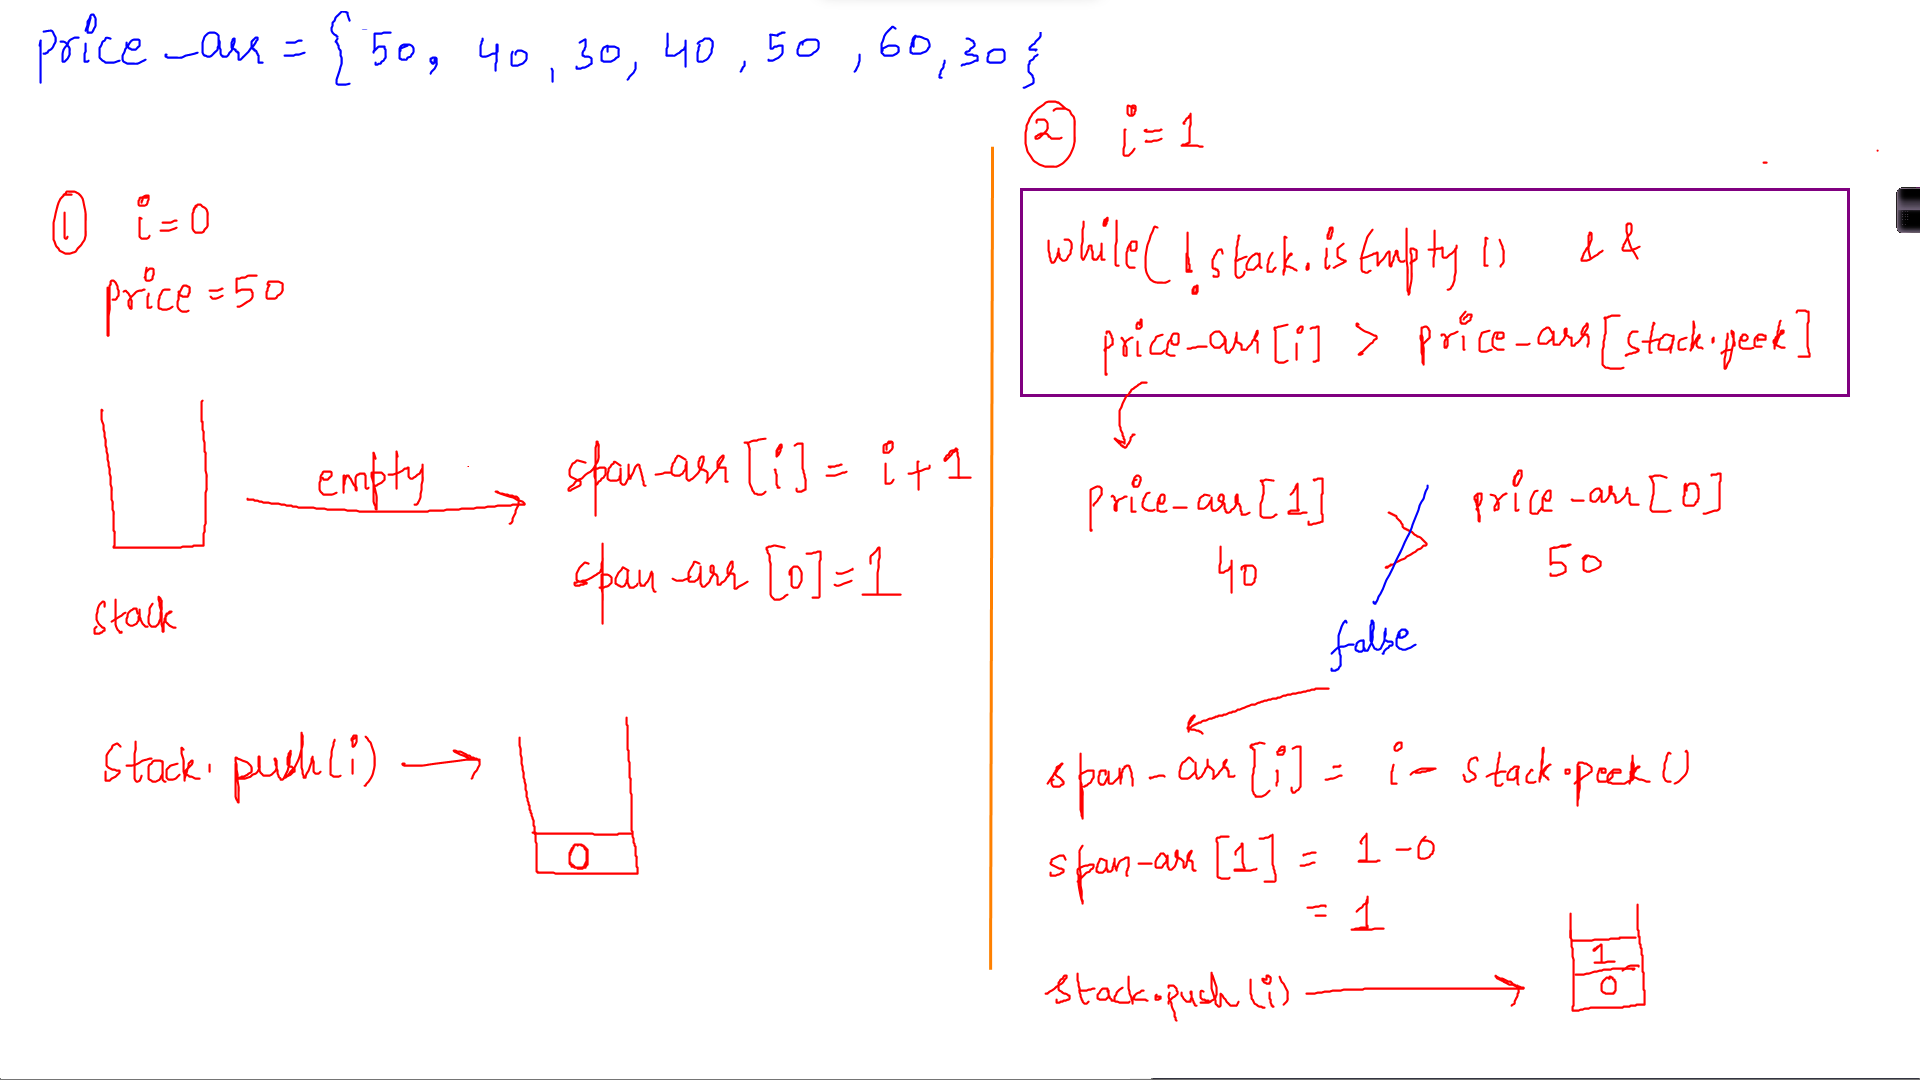
Given price_arr= {50,40,30,40,50,60,30}
For iteration i=0; For iteration i=1;
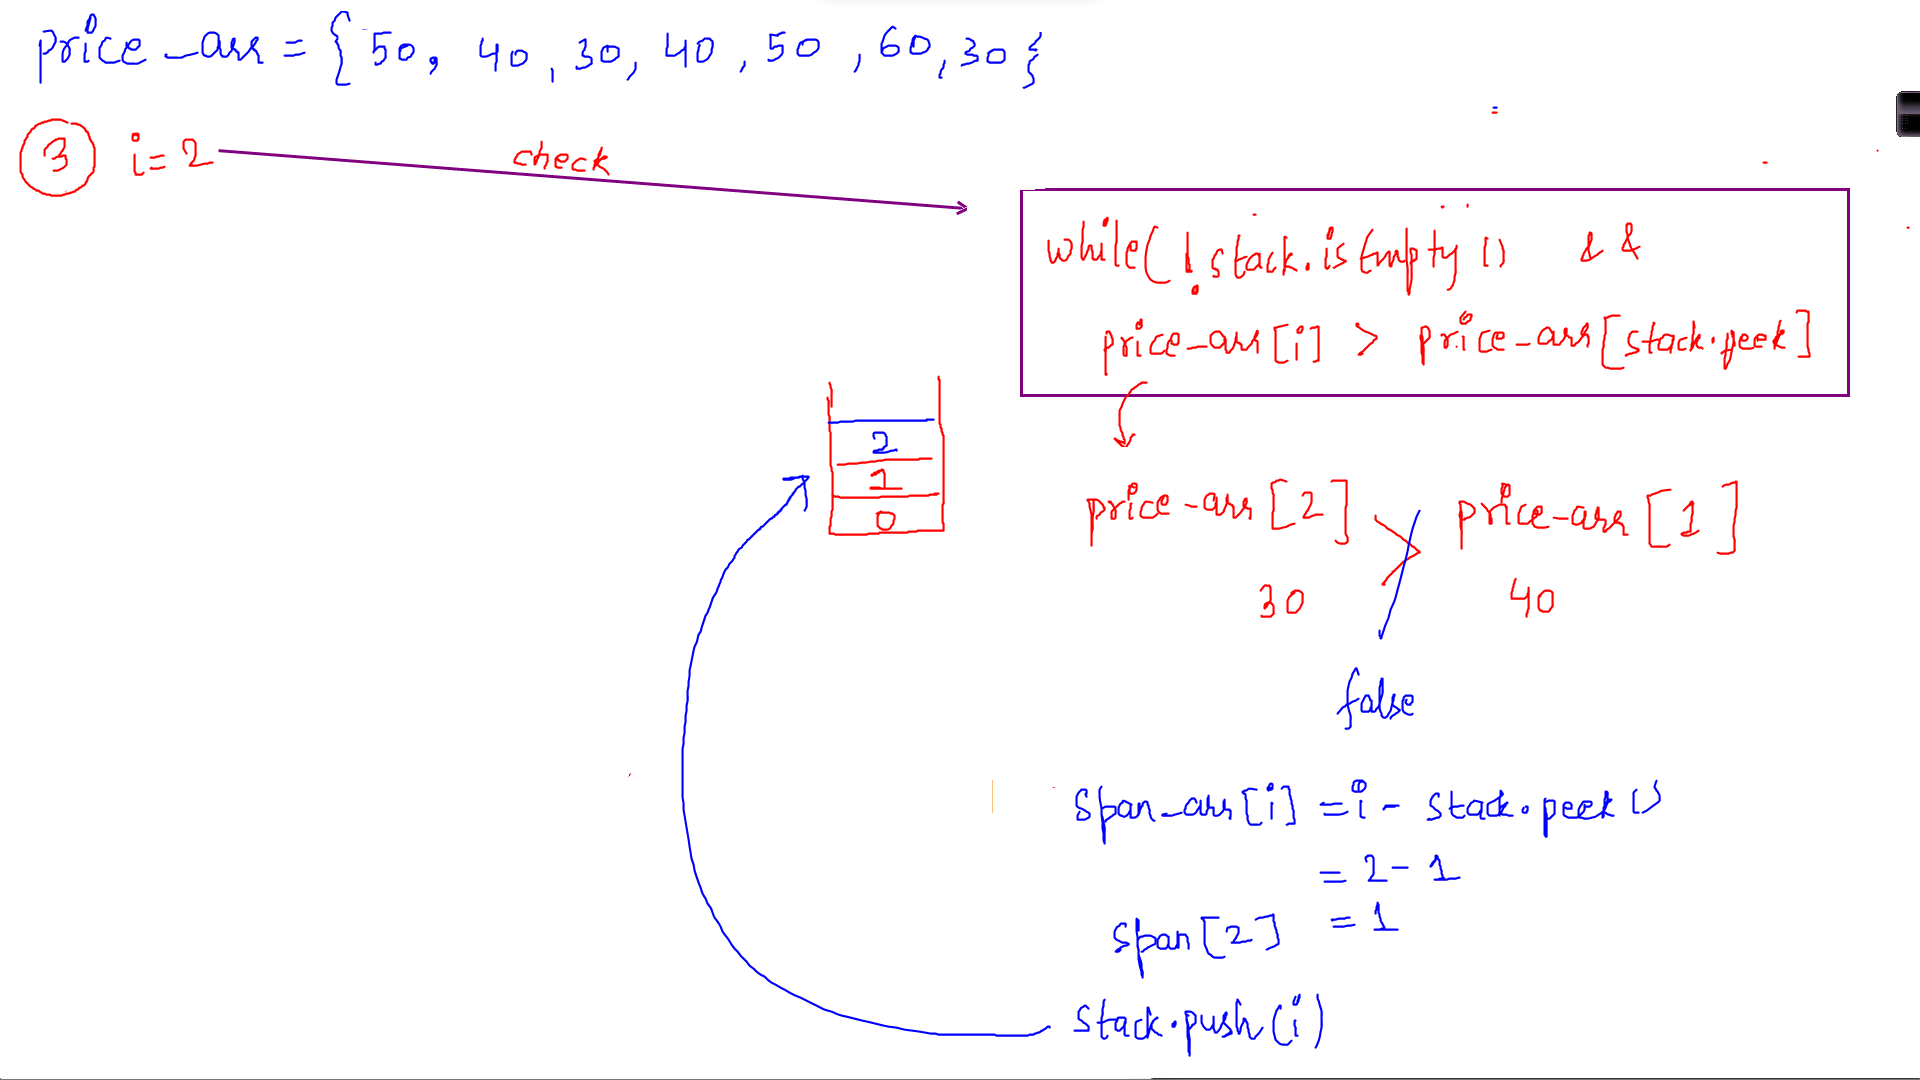
For iteration i=2;
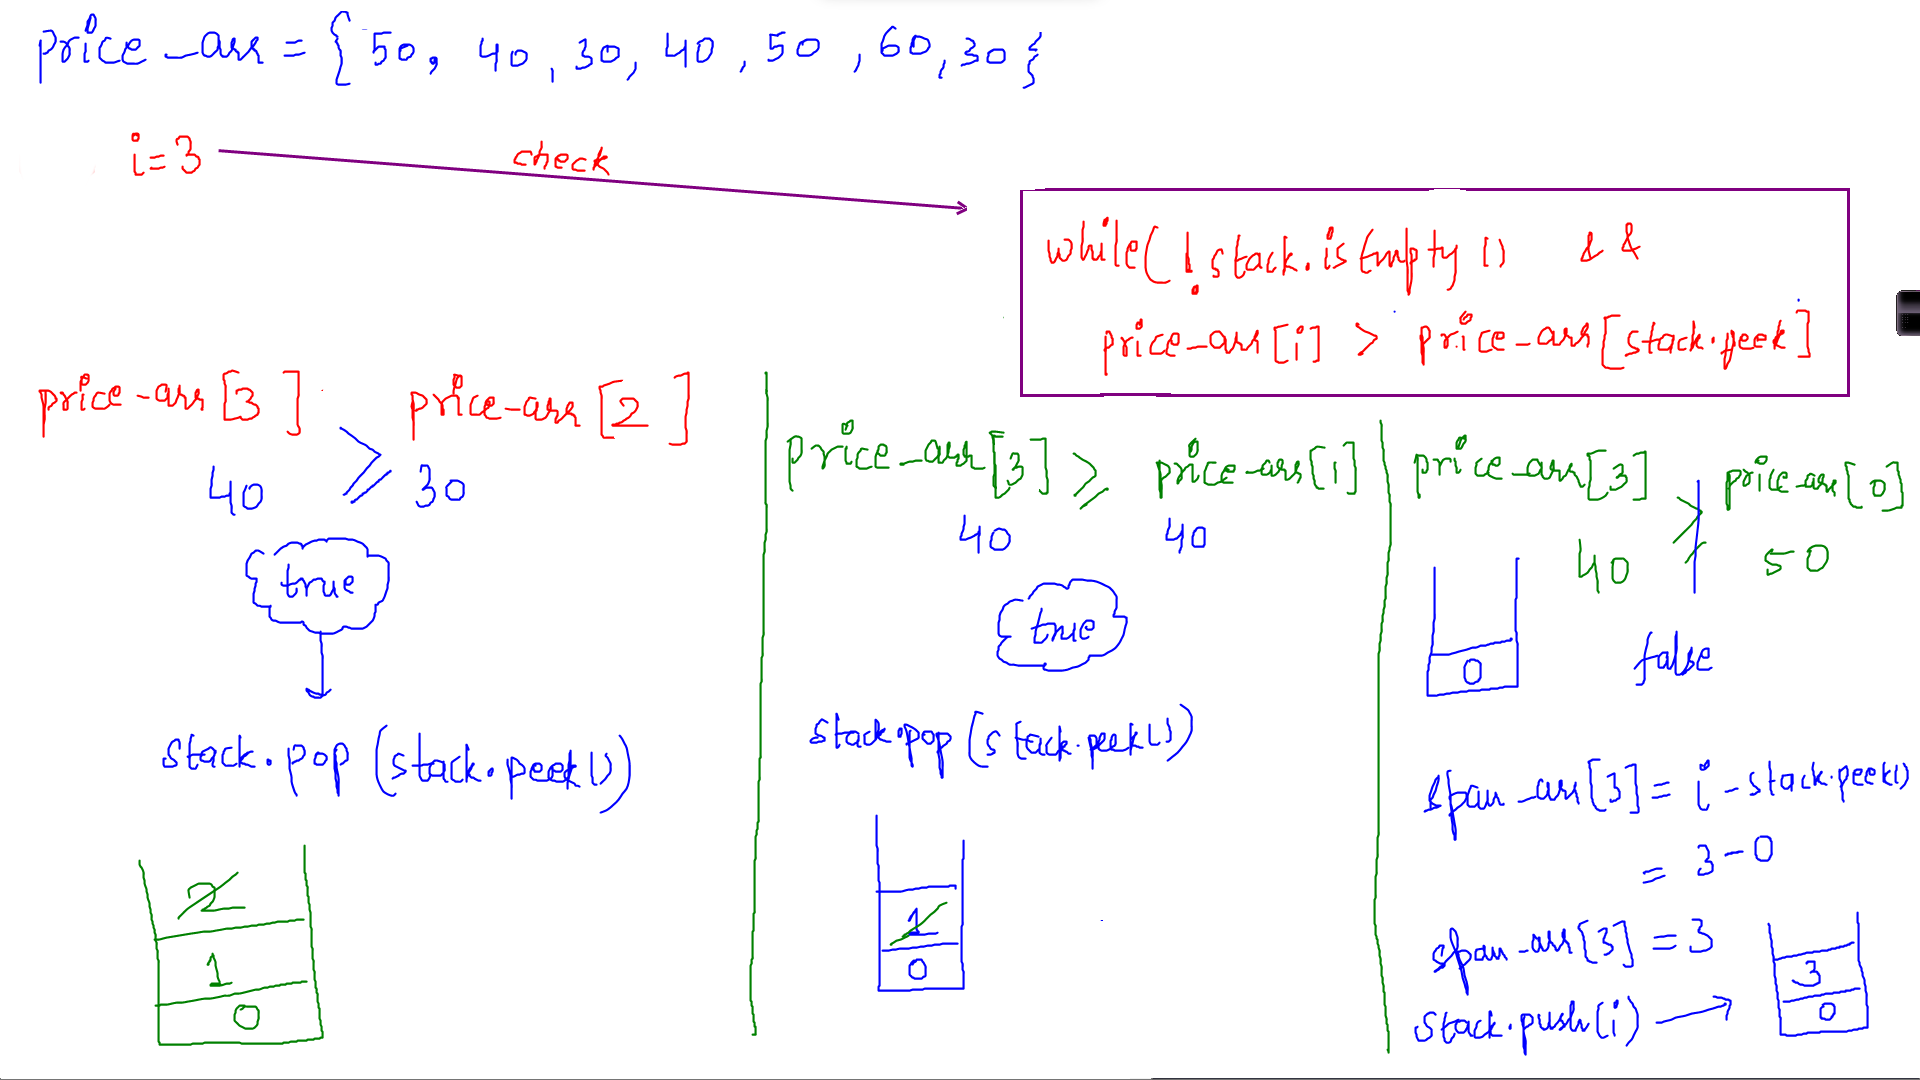
For iteration i=3;
For iteration i=4;

For iteration i=5;

For iteration i=6 (last index);

Hence the span_arr for given price_arr is:
price_arr[] ={50,40,30,40,50,60,30}
span_arr[]={1,1,1,3,5,6,1}
Now time to code.........
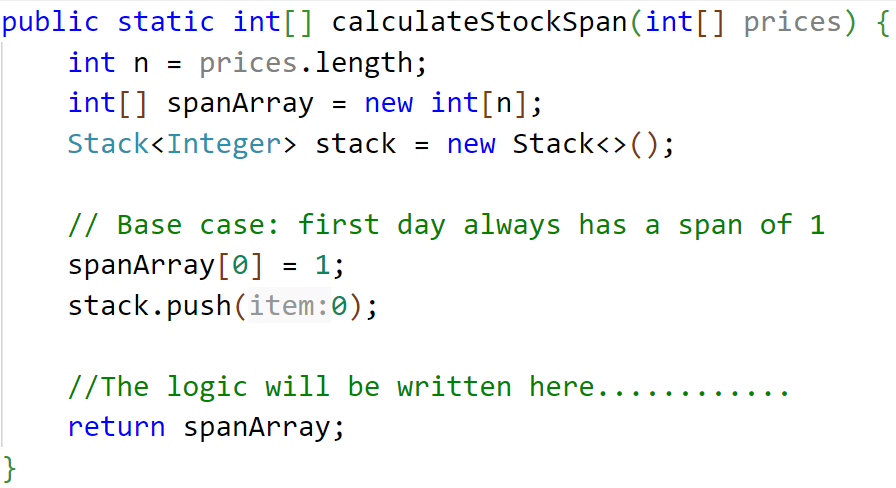
Let's create a function named as calculateStockSpan in which we will pass the prices array of length n. We will initialize a new spanArray of length n as well as a Stack of type integer.
Secondly, will implement the solution using a loop in which we will iterate from the first index element to last one and will calculate the span_Array ....
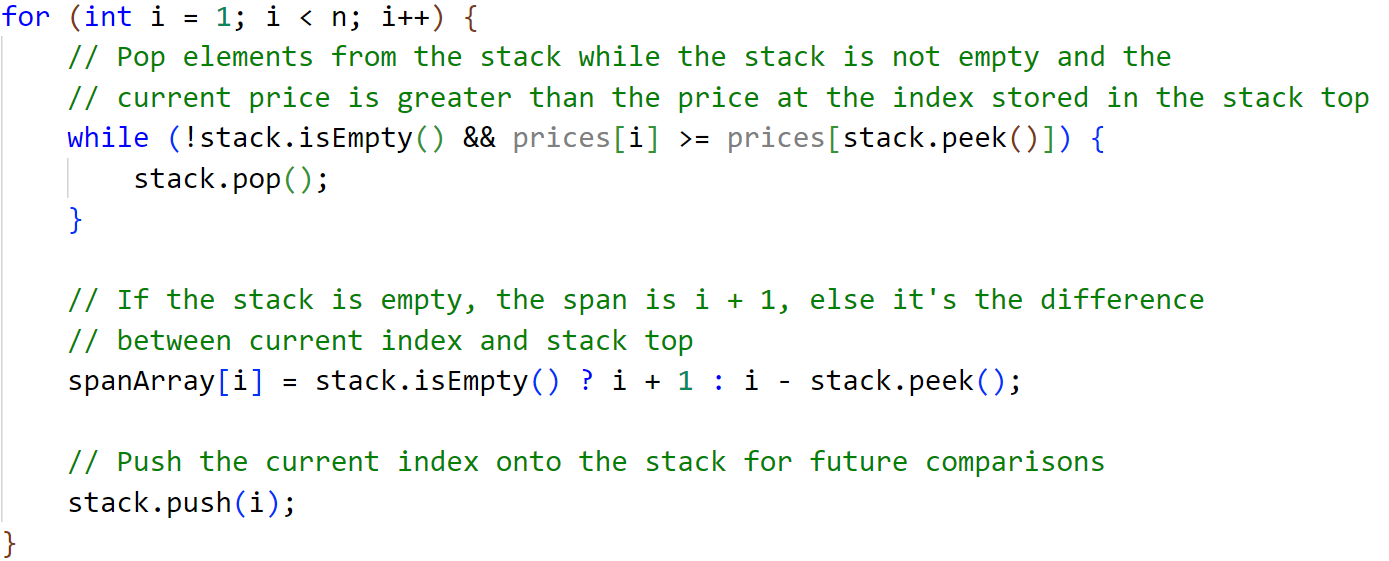
The final code looks like this:

Time Complexity Analysis:
The time complexity of the stack-based solution for the stock span problem is O(n), where n is the number of days in the price array. In this approach, each day's index is pushed onto the stack once and popped from the stack once at most, making the time complexity linear concerning the number of days.
I hope you all will find this helpful.
Thank you for joining us on this journey through the fascinating world of stock span algorithms. If you found this content helpful and insightful, don't forget to share this article. Stay tuned for more exciting insights, happy learning, and happy trading!"😊😊